 . The following dialog appears.
 | Contents | ||
|---|---|---|
| Prev |
Next |
|
It's a good idea to explain the capabilities of jBixbe by performing two debug examples step by step. The examples are typical program visualizations. That means we don't search for a specific bug but maybe we trace one.
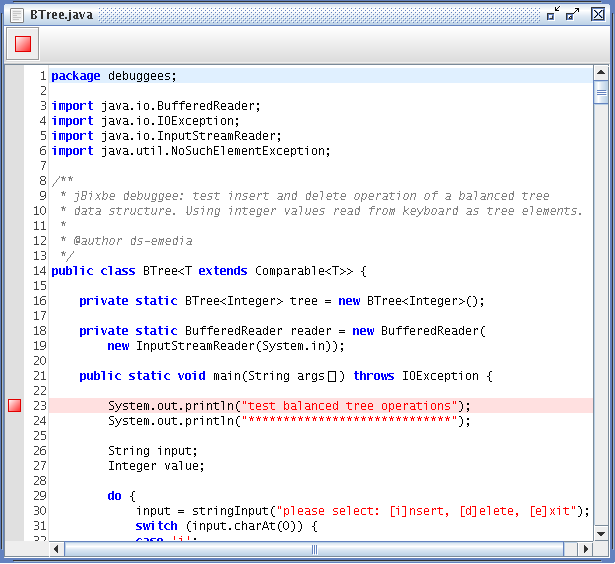
The first example deals with a tree data structure. It enables the user to insert and delete integer values reading from keyboard into a balanced tree. The tree consists of nodes where every node has a left child, a right child and a father node. All values left from a node are less than or equal to the node value and all values right from a node are greater than the node value.
Let's have a look at the source code. There is a class BTree with a main function that reads user input and builds up a balanced tree. At the moment we do not explain more. jBixbe will show us what happens.
The following sections explain how to set up a project manually. If you want to skip these steps you can go to Help menu and choose Tutorial Projects to set up the BTree project and continue your reading here. Note, it is not possible to save prepackaged projects.
Copy the given source code into a newly created file and store it as BTree.java into a newly created directory debuggees (appropriate to the package declaration within the Java source). The directory containing the debuggees directory is called the start directory. When we say debuggee it's the program to debug.
Compile BTree.java with all debug information. Assume you have a command line, than change to the start directory and type javac -g debuggees/BTree.java.
Basically, jBixbe will work with classes that have no debug information but understandably there are a few restrictions: no source code breakpoint can be triggered and the program flow cannot be traced at source code level within such a class.
The compiler produces two classes, BTree.class and BTree$Node.class within the debuggees directory. That's all for the debuggee. Now start jBixbe.
Before debugging you have to configure a new project that takes all settings for the new debug session. Go to File menu and choose Configure Project... or click at the corresponding button . The following dialog appears.
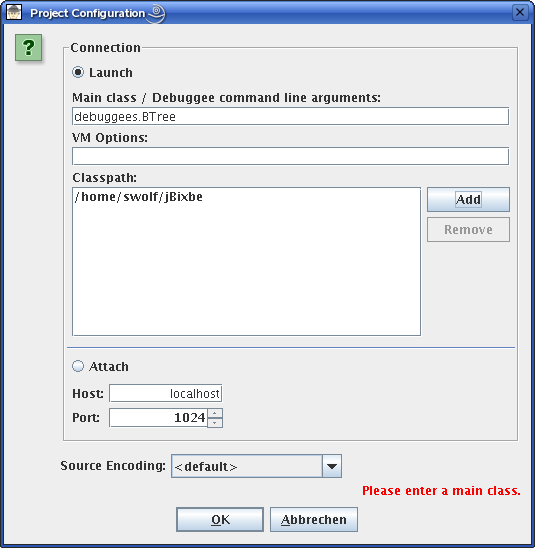
There are two possibilities to start debugging. Launch starts a new Virtual Machine at the local system and attaches jBixbe to it. Attach attaches jBixbe to a Virtual Machine already started at the local system or at a remote system. Read more about remote debugging later in this tutorial. For our example we want to start a new Virtual Machine at the local system so choose Launch.
At first specify the main class, the class containing the public static void main() method. The second line captures any further options for the Java Virtual Machine used to start the debuggee (e.g. -ea for enabling assertions). We leave it empty for our example. Finally you have to build up the debuggee classpath. Add all start directories containing a package structure that should be accessible over the classpath. Remember, a zip or jar file can also be the starting point of a package structure. For our example add the directory containing the debuggees directory. That's all here, click OK.
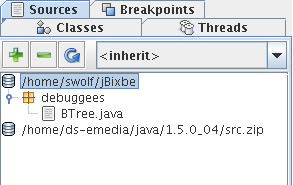
Now jBixbe knows the class files but does not know source files. Sources are managed by the source file overview that belongs to the system overview panel (the four tabs at the left side).
Choose the Sources tab, mount, unmount and refresh all sources here. Mount in contrast to add means the directories you specify are completely read. Sources are mounted in the same way as classpath elements are added. Never mount a single source file, always mount a start directory of a source package structure. If such a structure is contained within a zip or jar file mount the zip or jar file. For our example mount the directory containing the debuggees directory.
If you installed the Java Development Kit (jdk), it's also a good idea to mount the Java sources. After mounting you can inspect packages and source files by a double click on a start directory or package.
Save all your settings to a project file via File - Save Project as....
Start a new Java Virtual Machine by clicking at the Start/Continue button  or press F5.
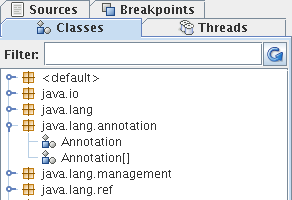
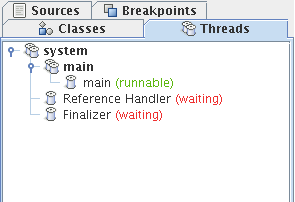
At this point the Java Virtual Machine is initialized and ready to execute the debuggee. The class overview (tab Classes) within system overview panel shows currently loaded classes ordered by their packages and as you can see the debuggee classes have not yet been loaded. Also a few threads are running showed by the thread overview (tab Threads) that hierarchically lists all threads and thread groups.
or press F5.
At this point the Java Virtual Machine is initialized and ready to execute the debuggee. The class overview (tab Classes) within system overview panel shows currently loaded classes ordered by their packages and as you can see the debuggee classes have not yet been loaded. Also a few threads are running showed by the thread overview (tab Threads) that hierarchically lists all threads and thread groups.
On your next continuation (F5), the debuggee will be started but if it is a run-through application without any user interaction it will be finished before you see everything. So it's better to set a breakpoint enforcing a stop at a specific location. Well, our example has user interaction but we want to set a breakpoint too.
Go to the sources overview and double click at the source file where you want to set the breakpoint, in our example this is BTree.java. jBixbe opens a static source code view showing you all source lines of the selected file. Set a breakpoint by a double click at a line number or with F8 for the currently selected line. Remove a breakpoint in the same way by a double click on an existing one. Be sure to set the breakpoint at a line that also contains source code, not at an empty line.
See the breakpoint overview within the system overview panel (tab Breakpoints). There you can observe all of your breakpoints. It's also the central place for breakpoint deletion. In our example set a breakpoint at line 23 and close static source code view. To see the breakpoint in context of whole source file again click at the breakpoint (select left cell) and choose New View - Source from context menu.
Continue debuggee. It will be next stopped at your breakpoint and the breakpoint overview shows additionally which thread has reached the breakpoint.
Let's start source code debugging. Actually, we do not need the whole source file for tracing program flow so it's better opening a dynamic source code view. It shows the source code of only one method from the call stack of a thread and the thread's current location. Go to the breakpoint overview, click at the main thread reached your breakpoint (select right cell) and choose New View - Source from context menu. Alternatively, go to the thread overview, select the main thread and choose New View - Source from context menu.
Now, jBixbe extracts all source code elements of the main method from the source file. This reduces space needed for source code representation to a minimum. In cases where you want to see the current location in context of whole source file click at the Open whole source file button  .
.
Select step in, step over and step out as you know from other debuggers but note, your selection is only a setting for the dynamic source code view. Still click at for continuing the debuggee. Maybe you think that's a little bit inconvenient (click two buttons) but in our experience the step selection changes not so often.
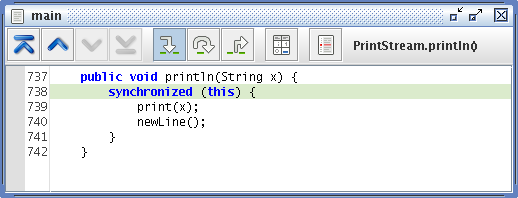
Choose step in and continue. Assume, you mounted the Java sources you will see the println method of the PrintStream class. The navigation operations left from step operations provide a quick navigation within call stack (top, up, down and bottom). See method local variables values by clicking at the show local variables button  . Choose step over and continue a few times or choose step out, coming back to the main method.
We could trace the main method for a while but maybe this is not so interesting. It's better to build up a tree and see if it was correctly balanced. Close the dynamic source code view and continue the debuggee. It will run until user interaction because there are no other breakpoints and views. Go to the standard io view (tab Standard IO) below and click within the text input field. The input of this text field is forwarded to the debuggee. Enter the integer values you want to insert into the tree step by step. We choose the following: 12, 7, 2, 45, 56.
Let's visualize the tree. Open a new structure diagram by clicking at the button .
Go to the classes overview and click refresh button
.
Go to the classes overview and click refresh button  to update the overview.
Note, the classes overview is not automatically refreshed because it's too time-consuming and would perceptibly delay your debug session. Open the debuggees package and move the BTree class per Drag & Drop to the opened structure diagram. Click at the tree attribute that looks like a link, the current BTree object is inserted. It gives you access to the tree root so you have access to the whole tree. Click at root attribute to insert the root node object and so on. Note, for a null reference the link is missing.
to update the overview.
Note, the classes overview is not automatically refreshed because it's too time-consuming and would perceptibly delay your debug session. Open the debuggees package and move the BTree class per Drag & Drop to the opened structure diagram. Click at the tree attribute that looks like a link, the current BTree object is inserted. It gives you access to the tree root so you have access to the whole tree. Click at root attribute to insert the root node object and so on. Note, for a null reference the link is missing.
Select an element from the diagram by clicking on it. If you want to select more elements hold the mouse button pressed and select them all. You can free arrange elements and delete selected ones by press Del on the keyboard. If you have not enough place to see the whole tree you can additionally enlarge the view panel by using the arrows at the panel borders
 . So after a short time you get an overview over the whole tree.
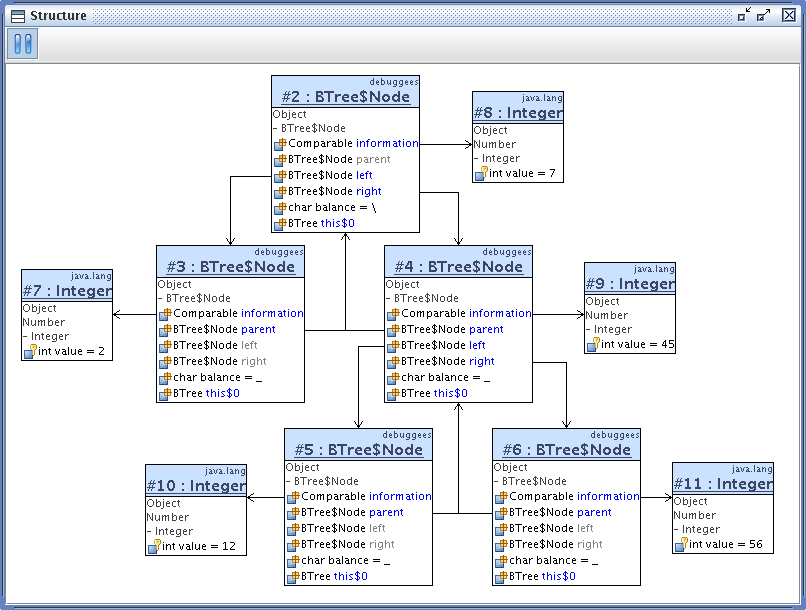
Look at the balance attributes and see immediately whether the tree was correctly balanced or not or watch inserted integer values. All values left from a node are less than or equal to the node value and all values right from a node are greater than the node value. And finally all references (parent, left, right) seems to be correctly.
The structure diagram automatically monitors attributes for changes so you can watch tree restructions when inserting or deleting a node. Insert integer value 1 and continue the debuggee. At first a left child to the node containing value 2 is created. Click on the attribute to include the new object. Continue the debuggee step by step and watch the tree balance.
Delete node with value 45. See value 12 is moved to the node that previously refers to value 45 and all references to the old node are deleted so the node can be garbage collected. Delete old node and information object also from the structure diagram. Well, the tree seems to be correctly.
Let's watch object interaction when deleting node with value 56.
Type "d" at the text input field and press Enter. Than type 56 but do not press Enter immediately because we want to watch this deletion operation.
All tree operations are executed by main thread. Have a look at what the thread is doing. Go to thread overview, select main thread and choose New View - Callstack from context menu. This opens a new empty sequence diagram. Add objects and classes that are involved in deletion operation. This sounds complicated but it's very easy. Move the BTree object from the structure diagram by Copy & Paste to the sequence diagram. If you have not included the BTree object Drag & Drop this$0 reference from any node. By the way, it's also possible to move classes from classes overview to a sequence diagram or classes and objects from sequence diagram to structure diagram. Now press Enter within the text input field.
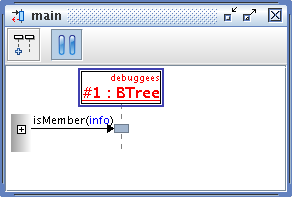
A sequence diagram defines a communication system, where added classes and objects act as communication partners. The left bold line is called the system border. It hides all communication partners situated outside of the communication system. You can include them by a click at the "+" within the system border or in other words follow the incoming or outgoing method call. Click at the "+" that belongs to the isMember method call to include the BTree class. You can also change order of communication partners by select them and moving them at the desired position.
On every method call all method arguments are visible. Click on an object reference within arguments to include the object into the diagram.
Additionally, open a dynamic source code view for the main thread to see what happens at source code level. This can also be simply done by a double click on the desired method in the sequence diagram. Now, your view panel should roughly look like the following.
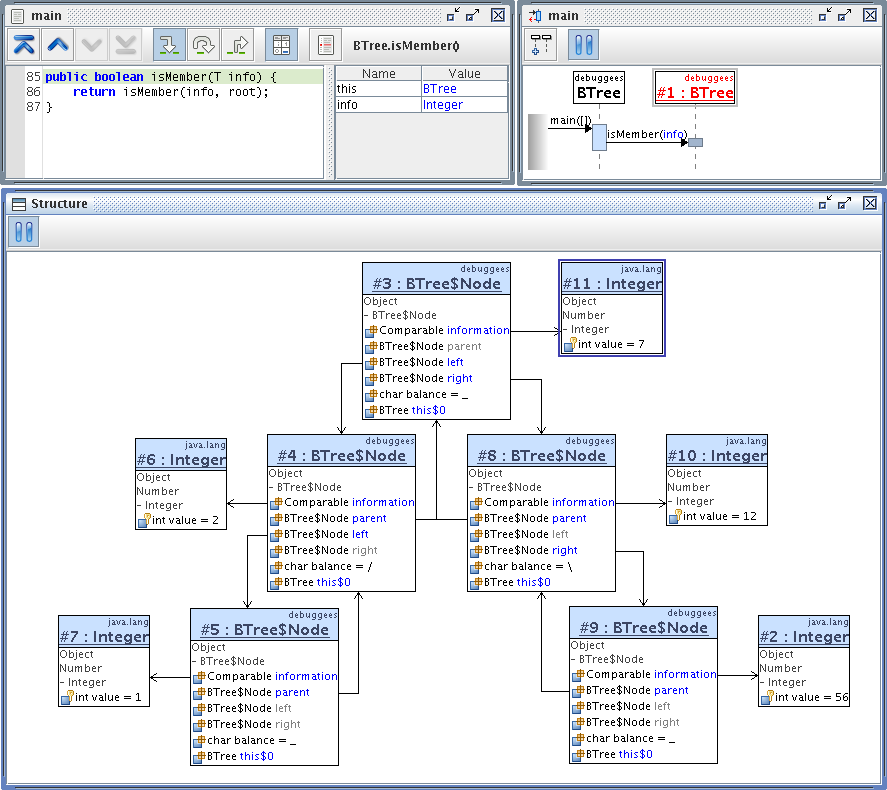
Let's have a look at the local variable table within the dynamic source code view. It shows the local variable values of the isMember method. References are displayed as links as you know from jBixbe. So you can also drag objects from local variables and drop them into any diagram. Note, when working with jBixbe, sometimes you will come to the question: How can I get access to an object? A simple solution is to drag the desired object from the synthetic local variable this of any object method.
Before you continue the debuggee let's still explain a jBixbe feature.
You will use step in, step over and step out but maybe, you will be a little bit confused about what happens if you select step over or step out.
A mechanism called event oriented flow control is active. The dynamic source code view does exactly what you said. It will make a step over or a step out and will be next active if this step is made. But jBixbe always continues a debuggee until an event appears that's of interest for any visible view and therefore of interest to you (e.g. a method call shown in sequence diagram or an attribute change in structure diagram). If you do not want this behavior you can instruct a view not to stop debuggee if an event occurs. Click at the Pause on next event button  to switch that behavior on/off for a view (default is on). In our example you could switch it off for the sequence and structure diagram so you can control program flow from dynamic source code view. This seems to be very simple but you should a little bit think about it. It gives you a lot of possibilities for flow control.
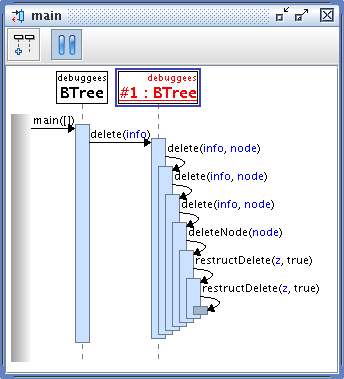
Back to our example. Remember, we are deleting value 56 from the tree. The tree first checks if the value is a member and than the delete method is called. Browse through tree operation step by step and watch tree restruction in structure diagram, call stack and object interaction in sequence diagram and source code within dynamic source code view. Have for example a look at tree recursions.
You can compare an object between different views by means of its identifier (e.g. #1) to see which object is meant. Or use Drag & Drop mechanism to exchange objects between views. If an object is already present in a view it is selected, otherwise it is included.
That's all for this example but take time and make your own attempts.
If you want to finish the debuggee click on Finish Session button  .
If you finish jBixbe all of your changes made to the project (e.g. added breakpoints) are automatically saved and will be loaded on next start.
.
If you finish jBixbe all of your changes made to the project (e.g. added breakpoints) are automatically saved and will be loaded on next start.
The previous example introduced jBixbe basics. This example makes more use of sequence diagrams and the different possibilities of flow control. It deals with a simple multi-threaded debuggee. Such debuggees are often a big challenge for debuggers because of timers, timeouts, synchronizations, race conditions and so on. Let's see what jBixbe can do.
We use the example from our website called the "smoker problem". Once again, here is the short explanation. Three smokers sit around a table in a pub and are served by a waitress. In order to smoke a smoker needs paper, tobacco and matches and every smoker owns plenty of one of the three items. The waitress lays two items on the table and every smoker grabs at his missing items. See the source code here.
Copy the source to the new file ThePub.java and save it into the debuggees directory. Compile it with debug information and start jBixbe. Configure a new project, set main class debuggees.ThePub, add the directory containing the debuggees directory to your classpath and save the project under ThePub.bix. Or go to Help menu and choose Tutorial Projects to set up ThePub project.
Start a new Java Virtual Machine. Our example is not a run-through application, the run method of all threads contains an endless loop. Therefore we need not set a breakpoint, simply start the debuggee. See thread overview, after a short time four threads are running. See continue button, you cannot click on it. What can you do now?
The debuggee is running because there are no views in view panel, no breakpoint was set and therefore no debug events occur that can stop debuggee.
Open a new sequence diagram for every smoker and for waitress. Every sequence diagram is empty and the debuggee is still running. Move "smoker with paper" thread object from the thread overview per Drag & Drop to the appropriate sequence diagram, the diagram that belongs to the thread. But now, jBixbe stops debuggee because you have defined that you want to see something.
See the "smoker with paper" object and the thread's run method. Click at the "+" in system border to build up your communication system or click the fast include button  . This causes inclusion of recently called objects and classes.
jBixbe extracts this information from the call stack of the appropriate thread.
. This causes inclusion of recently called objects and classes.
jBixbe extracts this information from the call stack of the appropriate thread.
Move the other thread objects to their corresponding sequence diagrams. This also updates the thread overview so you will watch current thread states. Note, that are not really the current thread states because jBixbe has suspended all threads but suppose that were the current thread states if the application runs out of a debugger.
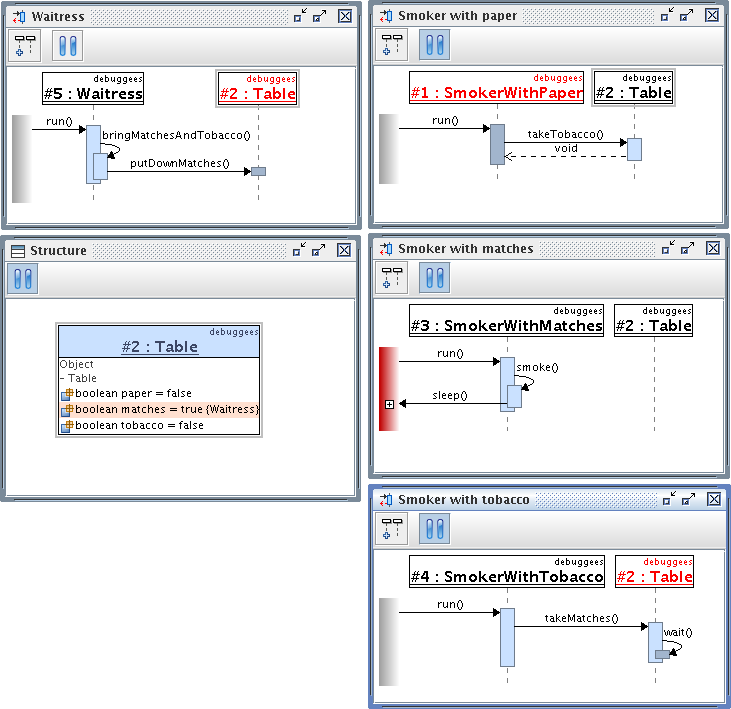
Let's have a look at which items are currently on the table. Open a structure diagram and insert the table object you see in any sequence diagram (Drag & Drop). Your view panel should roughly look like the following.
Continue the scenario step by step and see what the threads are doing.
The event-oriented flow control handles at its own how the scenario has to be controlled so that no important events are skipped. The only thing you have to do is to press the continue button or to include any further objects into any sequence diagram.
A view causes the debuggee to stop if an event for that view occurs. If you do not want this behavior switch it off by a click at the Pause on next event button.
Switch it off in all views and continue the debuggee. It will run without stopping on any event but all views are updated. On a fast machine, this could run very quickly. A configurable speed limiter is planed for a future version of jBixbe. However, you get a good estimation whether your multi-threaded application works as requested, for example no deadlock appears.
It's also a good idea to control the scenario from the structure diagram. Switch Pause on next event on for the diagram so the scenario stops whenever an item is put down or taken.
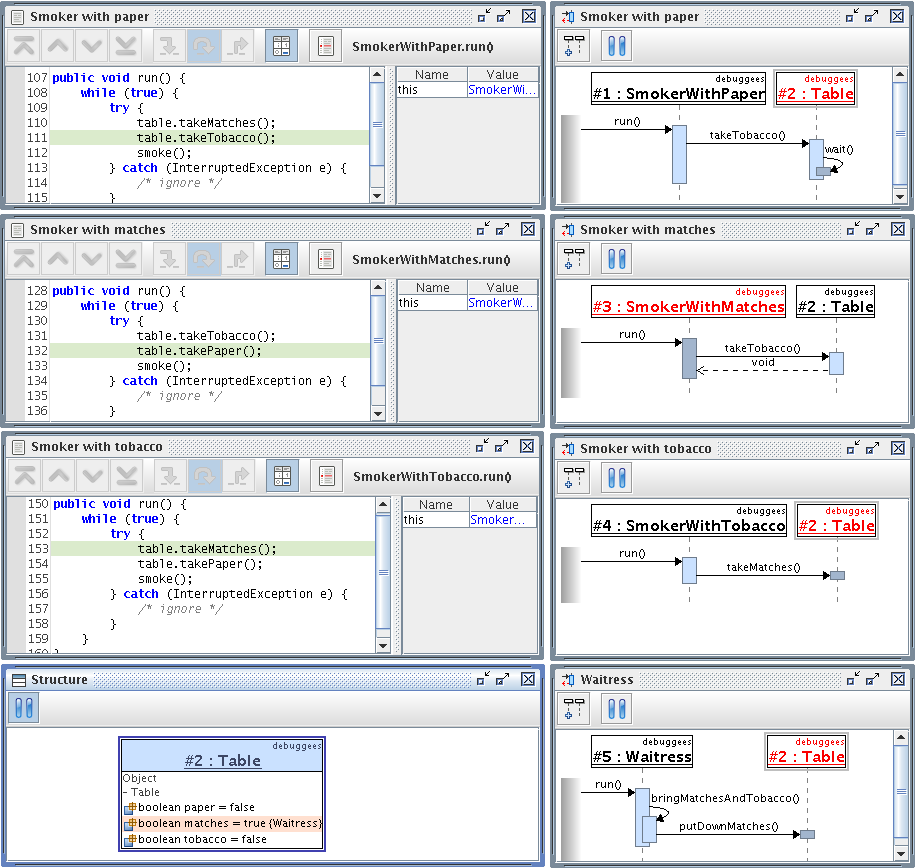
If you want to trace the scenario additionally at source code level you have to mount debuggee sources. Use source code overview to do this. Open a dynamic source code view for every thread.
As you have surely noted there are a lot of capabilities concerning visualization and flow control. The problem is not to handle jBixbe. It's a matter of practice. But you have to think a little bit more about individual usage of these capabilities to really get a new quality of debugging. But in our experience it's worth it.